
Introduction
For many years, I used an old-school X-rite 400 Reflection Densitometer to take readings of step-tablet prints, analog and digital, to 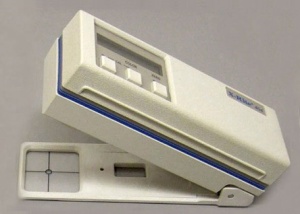 calibrate negatives for Platinum/Palladium prints and other alternative photographic printing processes. Two or three years ago the densitometer suddenly stopped working. I had a DataColor Spyder3Studio SR kit that I had gotten to calibrate my monitor and printers for digital printing, but until that time I had never thought of it as a substitute for the densitometer.
About the SpyderPrint
The DataColor Spyder3Print is a spectrocolorimeter. It reads LAB color values, which mimics human eye-brain perception. In other words, it is designed to see color the way we do. A densitometer, on the other hand, measures light absorption on a logarithmic scale, which is why a graphically linear plot of Density values looks visually dark. A graph of a linearization based on the L* (Lightness) component of LAB actually looks visually correct.
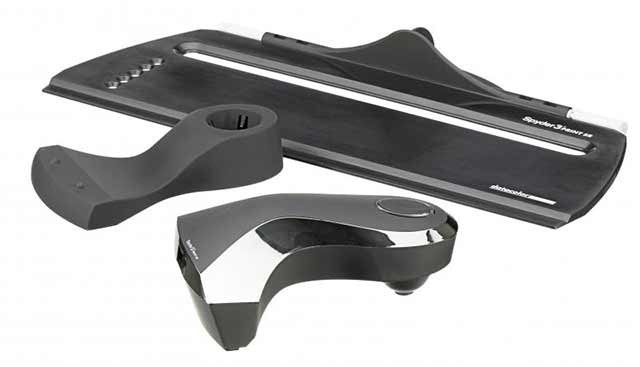
The picture above shows the 3 components of the Spyder3Print – the spectro itself (front), the base (middle), and the guide (back). The USB cable is not shown. Personally, I don’t use the guide, preferring to make my readings freehand.
For our purposes, we don’t use the standard Wizard based procedure that the SpyderPrint software guides you through when making profiles for inkjet printing on paper. Rather, since we are reading the results of printing a negative, we will use the manual Measure function under the Tools menu. Unfortunately, the manual is a bit lacking on how to use these tools. These two paragraphs are from the manual and that’s all there is about them. A call to DataColor support just referred me to this as well.
Tools Calibrate function: This button launches a calibration window that allows both black and white tile calibrations. It is not necessary for standard use; the calibration function occuring in the Wizard interface is all that is needed. Calibration from the Tools menu is a for special testing and support purposes, or for calibration when using the Tools Measure function.
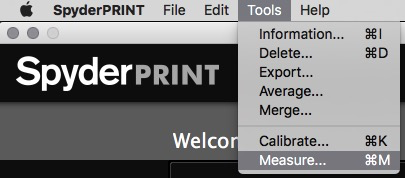
Tools Measure function: This button launches a measure window that allows measurements to be taken, and displays L*a*b* color values and Visual Density values of for each patch after it is read. If a log of measurements is desired, it can be named, and exported as Lab, Visual Density, or special QTR linearization and QTR CreateICC formats for use with QuadTone RIP®. Once the user completes the measurement set, the Done button stops the export process, and closes the Measure window.
Procedure
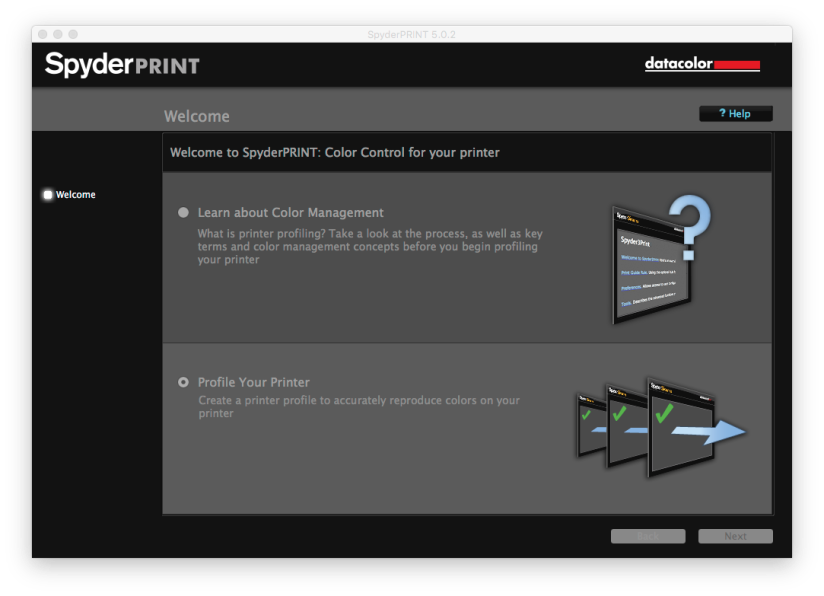
You skip all of the guided steps, but before you can access Measure on the tools menu you have to Calibrate.
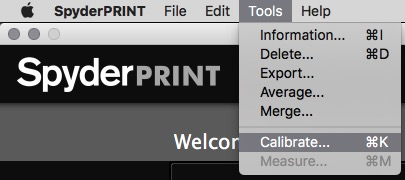
- Go to Tools>Calibrate (Command+K), make sure the Spyder is in it’s cradle and either push the button on the the Spyder or hit Return/Enter, then click OK.


- Now you can go to Tools>Measure (Command+M). Here’s where it gets a little less than straightforward.
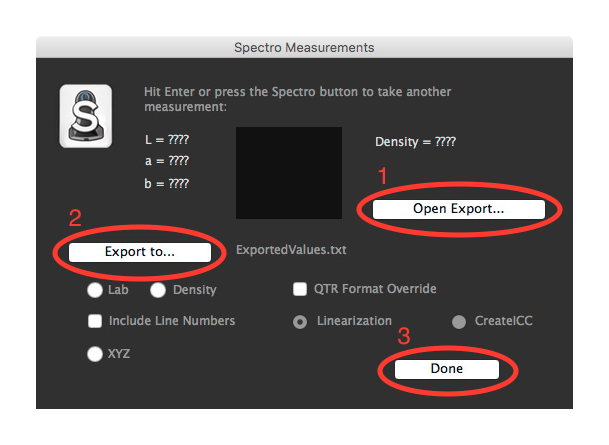
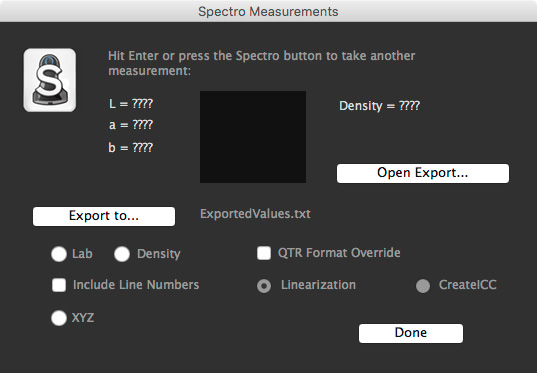
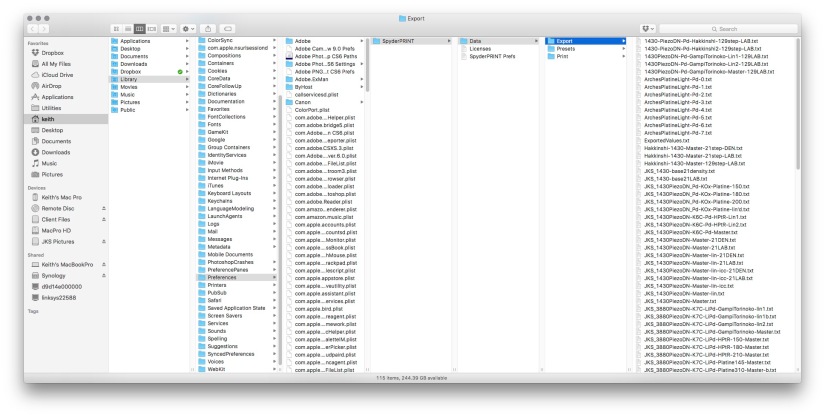
- First you need to select (1) Open Export …. This opens a Finder window showing a deeply buried folder where SpyderPrint saves data. (The full path, in case you ever need to find it without going through the app, is [username]/Library/Preferenced/Datacolor/SpyderPrint/Data/Export.)
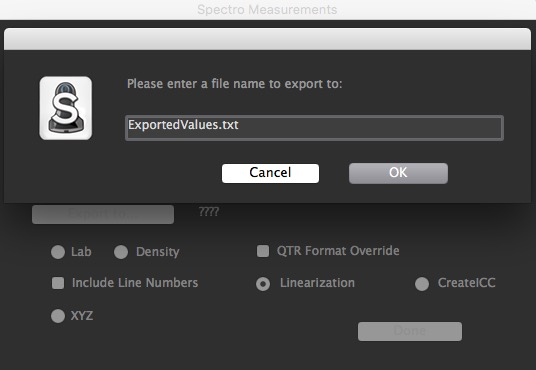
- Then go back to the SpyderPrint window and select (2) Export to …, it opens with ExportedValues.txt as a filename – change this to something meaningful like 1430PiezoDN-Pd-Master.txt, and click OK.
- Unless something else is checked, LAB is the default reading so you don’t actually have to select it here, but it’s ok to do so if you want. Just be sure nothing else is checked.
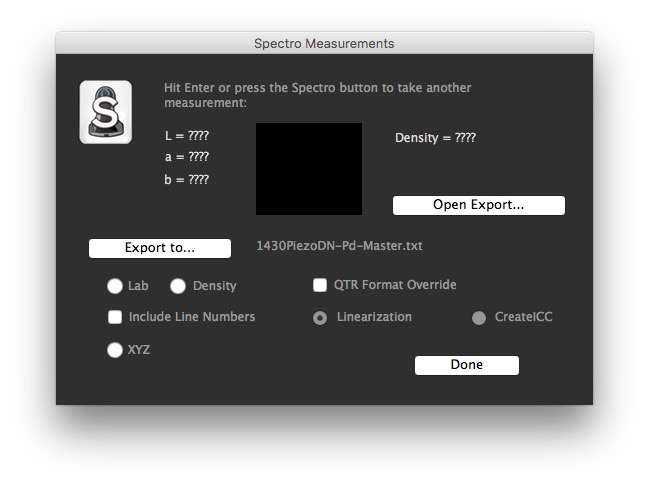
- To make your readings, begin at the lightest patch, set the sensor in the middle of the patch and push the button on the sensor (or push Return/Enter on your keyboard). Read each patch in order from lightest to darkest, then click Done.
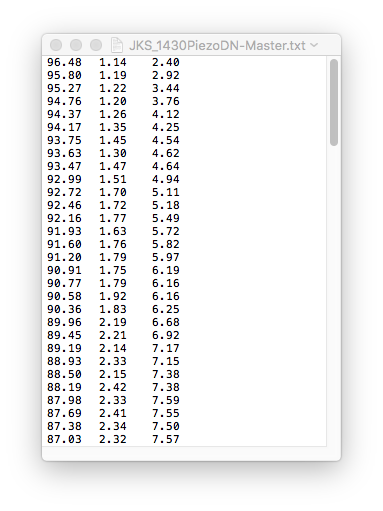
- The readings are saved as a Tab Delimited Text file in the above referenced folder. There is one row for each reading in the format L A B. Note that there are 129 rows in total, most of which are note visible in the screenshot.
- Open the file, select all (Command+A), copy to clipboard (Command+C), go to the Curve tab in the Smoother tool, right-click the top left cell of the green section, and select Paste. (Note: It is not necessary to select the entire range.) Make sure that the first and last L readings are in fact the lightest and darkest. Follow the instructions on the page.
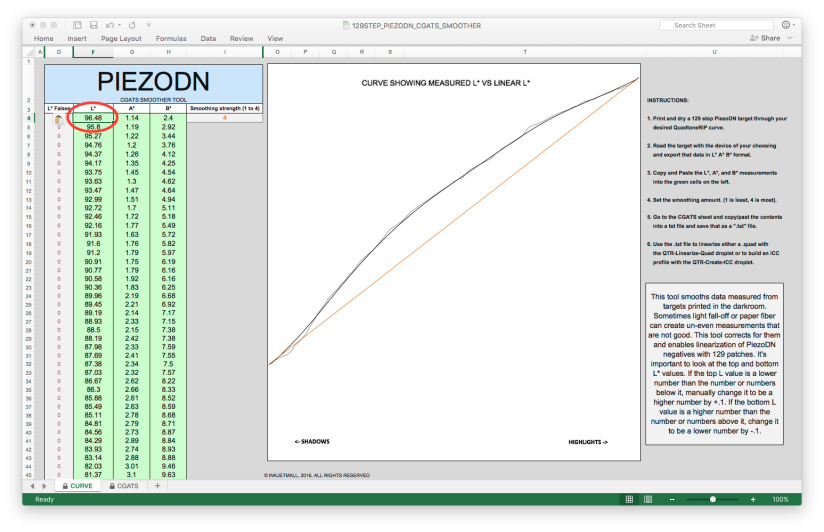
Note: The last step is shown here is for the PiezoDN method from InkjetMall. This particular method uses a 129-step test target. The spreadsheet tool illustrated here is called the CGATS Smoother. It smooths the raw data, correcting bumps and waves that are very likely to occur with any hand-coated process, and converts the data into the CGATS format which is then saved as a text file to be used with the QTR-Linearize-Quad and QTR-Create-ICC apps that are part of Roy Harrington’s QuadToneRIP. The SpyderPrint app has other QTR specific functions built in though I haven’t used them yet.
The process is similar for other methods which typically use 21- or 31-step targets which are much simpler to smooth manually. In most cases, at least for digital negatives, you will only need to use the L* column, especially if you are simply pasting it into a spreadsheet. Measurements can also be made in Density mode.

Thanks Keith for this. Just obtained this device and thought there was a way to make a curve to use in QTR to linearize for alt processes.
Hi- did you ever learn how to create a QTR curve using the spyderprint for alternative black/white ink dilutions? Is this even possible?
Apologies, Steve — this slipped through without the usual email notification. I just found it.
To be clear, I have not built curves from scratch myself. I always had some already existing starting curve to get me going, whether it was using Epson inks and starting from an ink descriptor text file as in jkschreiber.wordpress.com/platinumpalladium-notes/digital-negatives-with-quadtonerip/, or working with Piezography inks as I have been doing for the last 3-4 years and starting with quad files provided with the PiezoDN installation as the starting point and manipulating them using PiezoDN tools.
So I guess the simple answer to your question is that yes, it is possible, and it works very well with PiezoDN. But if you are wondering about a DIY inkset made from diluting black ink yourself, I have no personal experience to speak of. I do know of a few a few people who do though, such as Sandy King, and I think you might be able to find some information on the QTR forum which now resides on IO groups:
https://groups.io/g/QuadToneRIP/topics
Regards,
Keith
Keith, I was delighted to find your Spyderprint article and as a result have just bought one on eBay. I wonder if I may ask a couple of questions.
Firstly in point 5 you say that only LAB should be ticked but in the screenshot you show ‘Linearization’ ticked. Just wanted to check that that was correct as you don’t mention it in the article.
Secondly, you are using Piezography but I want to stick with my Epson inks and QTR (which I have). Have you used Epson inks or just Piezography. Do I have to get Excel or something to smooth the readings. Not quite sure how to proceed.
Would be grateful for your thoughts.
Regards
Charlie
Hi Charlie,
Excel, or some other spreadsheet, will be a very useful tool for creating and manipulating curves. I use it to keep track of linearization progress for a range of papers too. Each paper is a little different, some a lot different, and it is rare that a linearization made with one paper will be close enough to ideal for another. I’d be lost without a spreadsheet to keep track of all this.
If you take a closer look at the screenshot you will notice that the part you are referring to is grayed out. That means it is not active. It only becomes active if “QTR Format Override” is ticked, which for the way I am using this we don’t want. What I want here is the raw data as shown in the test file shown in step 7. From this, unless you are using PiezoDN (which uses all three columns of LAB) the easiest way to snip out just the L data is to copy/paste the text file into a spreadsheet where you can select just the L column data. You could also take Density readings rather than LAB, which will be only one column, and then plug that into something like Richard Boutwell’s excellent curve calculator which converts from Density to L and compiles the Gray Curve string to copy/paste into the Gray Curve field in your QTR profile. https://www.dropbox.com/s/qvz5rbc4zi868yi/BWMASTERY-21-step-QTR-Correction-Curve-Tool-for%20Digital%20Negatives.xlsx?dl=0
As for smoothing, I do think it is an important step. Before PiezoDN, which has a very sophisticated smoothing function built-in, I did this manually which is quite easy with curves of 21 steps or fewer. With 15- or 16-step Ps curves you can do it right in the Ps Curve window. (15 or 16 is the limit to the number of points in a Ps curve.) With 21-steps or more, you can make a simple spreadsheet graph and do it there. Simply adjust input or output values to smooth out the bumps and correct for read errors. If you use Richard’s spreadsheet, you can do it there in the input column.
Richard’s curve tool gets much closer to linear via the Gray Curve than any other curve creation tool I’ve made (or others I’ve tried), but the result will not likely be perfect. To fine tune it, the best option is to use the QTR Linearize function. Assuming you are using the Mac version of QTR, here is how to do it:
1. Print a 21-step test target using your new QTR Curve with the Gray Curve you created.
2. Print in the darkroom using exactly the same process parameters as previously.
3. Read the results with your spectro in either Density or LAB, and save as text file.
4. Use the QTR-Linearize-Data app to process the text file and produce the Linearize string to be pasted into your QTR text profile at the very end, after the Gray Curve.
5. Save the modified profile with a new name and install it.
6. Repeat the test to verify linearization.
7. Adjust if necessary.
I think this went a bit beyond your questions, but I hope it makes sense and is helpful. I need to modify my QTR digital negative article to incorporate these fairly recent changes to the way I make profiles for standard Epson inks. Even though I’m not making my own negatives that way since switching to PiezoDN, I do have a few clients I make curves for who are using Epson inks.
Cheers,
Keith
Hi Keith
Thank you very much for your very useful reply. I should have said that I made a QTR curve about 3 years ago using Ron Reeder’s method and came up with a reasonable curve that I have been using but struggled to linearise the mid tones. Thing is you read about developments in this field which makes you think you ought to have another go!
Picking up on your points 1 to 7 above. Point 1- I could use the curve I have but presume when you say make a negative you mean of a 21 step tablet.
Point 4- Could you tell me how to access the QTR-Linearize-Data app. Then do I just put ‘Linearize =’ at the end of my QTR text profile and add the readings?
I use straight a Palladium process and I read on the Yahoo QTR group in one post where you offered to send someone a copy of your QTR Palladium profile for reference. Would that be possible? I don’t have Dropbox and think you have my email but it’s Charlie.francis52@gmail.com.
Many thanks
Charlie
Hi Charlie,
Yes, I meant a 21-step test target. Thanks for pointing that out. I edited the previous post to.
QTR-Linearlize-Data.app is found in your Applications>QuadtoneRIP folder. It produces a text file with “-out” appended to the name of the input file. at the very bottom of the file, you will see something that looks like this:
Use the Digital Negative line – the whole thing. Copy/paste it at the end of your ink descriptor text file. It will look something like this:
Tell me what printer you are using and I’ll send you a Master text file for it.
Cheers,
Keith
Hi Keith
Many thanks again. My printer is an Epson R3000.
Just to be clear, if I follow your points 1 to 7, I take it I don’t need a spreadsheet which helps because I don’t have Office/Excel.
Kind regards
Charlie
If the points 1-7 you refer to are from my earlier reply to you, then please understand that that was regarding the LINEARIZE step which fine tunes what you should have already done with the GRAY_CURVE. That part of it does not require a spreadsheet since you will be entering the measurements directly into QTR-Linearize-Data, and from there into your text file.
But you really do need a spreadsheet to create the GRAY_CURVE for your QTR profile. You could try to do it by hand, or maybe with the Ps Curves window, but a spreadsheet makes it much easier. If you are on Mac, Numbers would do the job. And there is also Open Office which is free. I strongly recommend using Richard Boutwell’s spreadsheet that I linked to earlier for this. You will need a spreadsheet for it.
Here is a link to a base profile/curve for the R3000. I’m pretty sure you do not need to have a Dropbox account yourself in order to access and download this, but if that doesn’t work let me know and I will email it to you.
https://www.dropbox.com/s/cn06wm91fsctirm/R3000PK-Pd-Base.txt?dl=0
Hello Keit, some time ago I contacted you, I do not remember exactly the matter. From time to time I return to your blog since I find the articles that it is publishing very interesting. This time I read your article digital negatives with QTR.
Like Charlie Francis I’ve been doing my digital negatives with R.Reeder’s method, certainly the copies I’m getting I think are pretty good but lately all I’ve been able to read even the note of Reeder advises like you use Black ink Photo.
I am going to try with black photo if there is really improvement as it is said.
I would like you to answer a series of questions if possible.
In the profile for the QuadP800 printer in the section N_Of_Gray_Parts you make a delimitation of 3 parts while Reeder does it in two perhaps for simplicity as he says. Why three parts instead of two?
Likewise you set the range in 1 while Reeder does in 0.7 because it seems to give a more linear continuity in the midtones, I do not know to what extent this is so.
¿How relevant has been your experiments with Gray_Highlight and Gray_Shadow? ¿What have you noticed?
I use an Epson 3880 Printer, the Arches Platine paper and OHP pictorial for the negatives.
Do you have a profile for Pt / Pd or Pd with these materials?
Well sorry for the inconvenience, I hope you understand me esot is a translation from Google because my English is certainly poor hence the possible doubts that could not resolve.
Sincerely
Vargass.
Pd: One more question, what difference does it have to reveal with potassium oxalate at a dilution of 30% to a higher or lower?
Thank you

Hello Vargass,
Sorry for the delay in replying to your questions. There is some translation difficulty and I’ve had to read it several times to understand some of your questions. Some I think I understand, others maybe not, but I will try to answer.
I think you will find a significant improvement with Photo Black compared to Matte Black. At least I did.
I use all 3 blacks in my profiles: PK, LK, and LLK – therefore the 3 partitions. I believe Ron uses only PK and LK, therefore 2 partitions.
I’m not sure what you mean by range. Do you mean Gray Gamma? If so, I have used that in the past and it can be useful. It’s similar to the middle slider in Photoshop Levels.
Gray Highlight and Gray Shadow alter the shapes of the ink distribution curves as shown graphically in Curve View. I should add one of those to the article. I see that I used one graph twice by mistake.
The most important thing, and one that is completely absent from many profiles I’ve seen, is the Gray Overlap setting. Setting this to 100 means that the LK and LLK inks will be used over the entire tonal range. I believe this is essential to achieve maximum smoothness. The PK ink kicks in only at the point that it is needed.
I do have a new Pt/Pd curve that was thoroughly tested in a workshop 2 weeks ago. I will make it available for download, and update the article with Pt/Pd examples instead of cyanotype as soon as I can. Hopefully within a couple of days.
I hope this answers your questions and is understandable in translation.
Cheers,
Keith